The easiest way to understand tax filing - part 1
On your journey as an independent contractor, there can be a lot of confusion. We thought it was worth spending a few minutes to help provide clarity! Here's part 1 of Joe's story as an independent contractor filing taxes. It's a basic story and a quick reference guide:
Joe drives for Lyft, Uber, Sidecar, and Summon
and also does delivery for Postmates, DoorDash, SpoonRocket, and Sprig. He is an independent contractor for ALL of these and is responsible for filing a 1099-MISC for this income since he’s made over $600.
Joe has to pay about 1/3 of his $60,000 in taxes.
This includes paying state (~10%) and federal (~15%) taxes on that income. If Joe didn’t take any deductions, he’d owe approximately 1/3 of the $60,000 in taxes, or $20,000. That’s a lot.
Joe is savvy and has kept track of both work-related expenses
and work-related mileage. He can deduct these from his total income to reduce his taxable income. Joe spent $4,580 on expenses, including his car maintenance, car washes, oil changes, as well as his meals, cell phone bills, and snacks for his passengers, and more. (Anything he needed to perform his work) He diligently kept track of all of these!
It turns out his mileage deduction is worth more than his expense deduction.
He drove 12,300 miles total when he was driving for these platforms. Using the standard .56 cents per mile, Joe can actually deduct $6,888 from his mileage. So, Joe chooses to use the mileage deduction rather then the expense deduction. *Note: You can only choose one or the other, expense deduction or mileage deduction, not both.*
Now Joe subtracts his $6,888 mileage deduction from his $60,000 income and is left with $53,112 in taxable income. Setting aside 1/3 of that for taxes, Joe now owes approximately $17,500 in taxes!
How did Joe keep this records? And did he have to file quarterly taxes? Follow Part 2 of Joe's tax filing when it's first shared next week.
Feel like a tax expert now? Share the knowledge with the drivers you care about: Share on Facebook
Here are a few more resources for you:
Business Use of Vehicles by Turbo Tax
sherpa, lyft, uber, sidecar, tax, tax guide,
New CityMetrics and Platform Breakdown Statistics
Growing Independent Contractor Network on Sherpa
Some brand new stats on our original independent contractors, the drivers of Lyft, Uber, and Sidecar. Have you chosen your driving city yet? Your free Sherpa account invite
What's the takeaway? Of course California continues to grow fast with independent contractors driving for Lyft, Uber, and Sidecar, but the rest of the country is quickly catching-up. Sherpa's tracked 500,000 trips in nearly 80 cities, and is a place for first-time independent contractors to get help. Of course, you're a big part of this.
Your free Sherpa account invitecitymetrics, lyft, uber, sidecar, income, costs
Your Lyft, Uber, and Sidecar metrics, side-by-side
See metrics from each platform side-by-side
Introducing side-by-side comparisons of key Lyft, Uber, and Sidecar metrics.
That's right! You can now compare your metrics by platform! There are currently 3 side-by-side metrics you'll see: Your average trip distance, your average trip fare, and your average trip time. Take a look on your Sherpa Dashboard now.
If you're a new Sherpa user, you can see these metrics within a few minutes with this 'Comparative Feature VIP' link: Create your account.
Share the new feature with your friends!

Meanwhile, on Thursday, Scott, a guest contributor on The Rideshare Guy, wrote a review of the new feature and his impressions. Here's an excerpt:
"I pulled up my driving statistics in Sherpa this morning. I was a bit surprised at what I saw. My average Lyft fares were almost exactly the same as my UberX fares! Let me explain a bit. I have not driven for UberX until before their changes (before their 15% fare reduction) and I only drove for Lyft after their changes (commission changes). See above chart. If it’s a little tough to see, UberX is black, Lyft is blue and Sidecar is orange. I have so few Sidecar rides and demand is very spotty so that data is irrelevant. The data from left to right is distance, fare and time. So what can we see from this? The Lyft distance is slightly higher than UberX The UberX fare is slightly higher than Lyft **The Lyft trip time is significantly longer than UberX** The UberX fare doesn’t include the $1 trip bonus and the Lyft fare doesn’t include tips. I was surprised by this data and it made me think as to why this was. It didn’t take me long to realize that the difference in fare is due to time. Why is there a difference in time with my statistics? See more at: Read the rest on The Rideshare Guy
metrics, lyft, uber, sidecar
Booming Lyft, Uber, and Sidecar driving in California
Over 10,000 trips in California last week and several hundred drivers
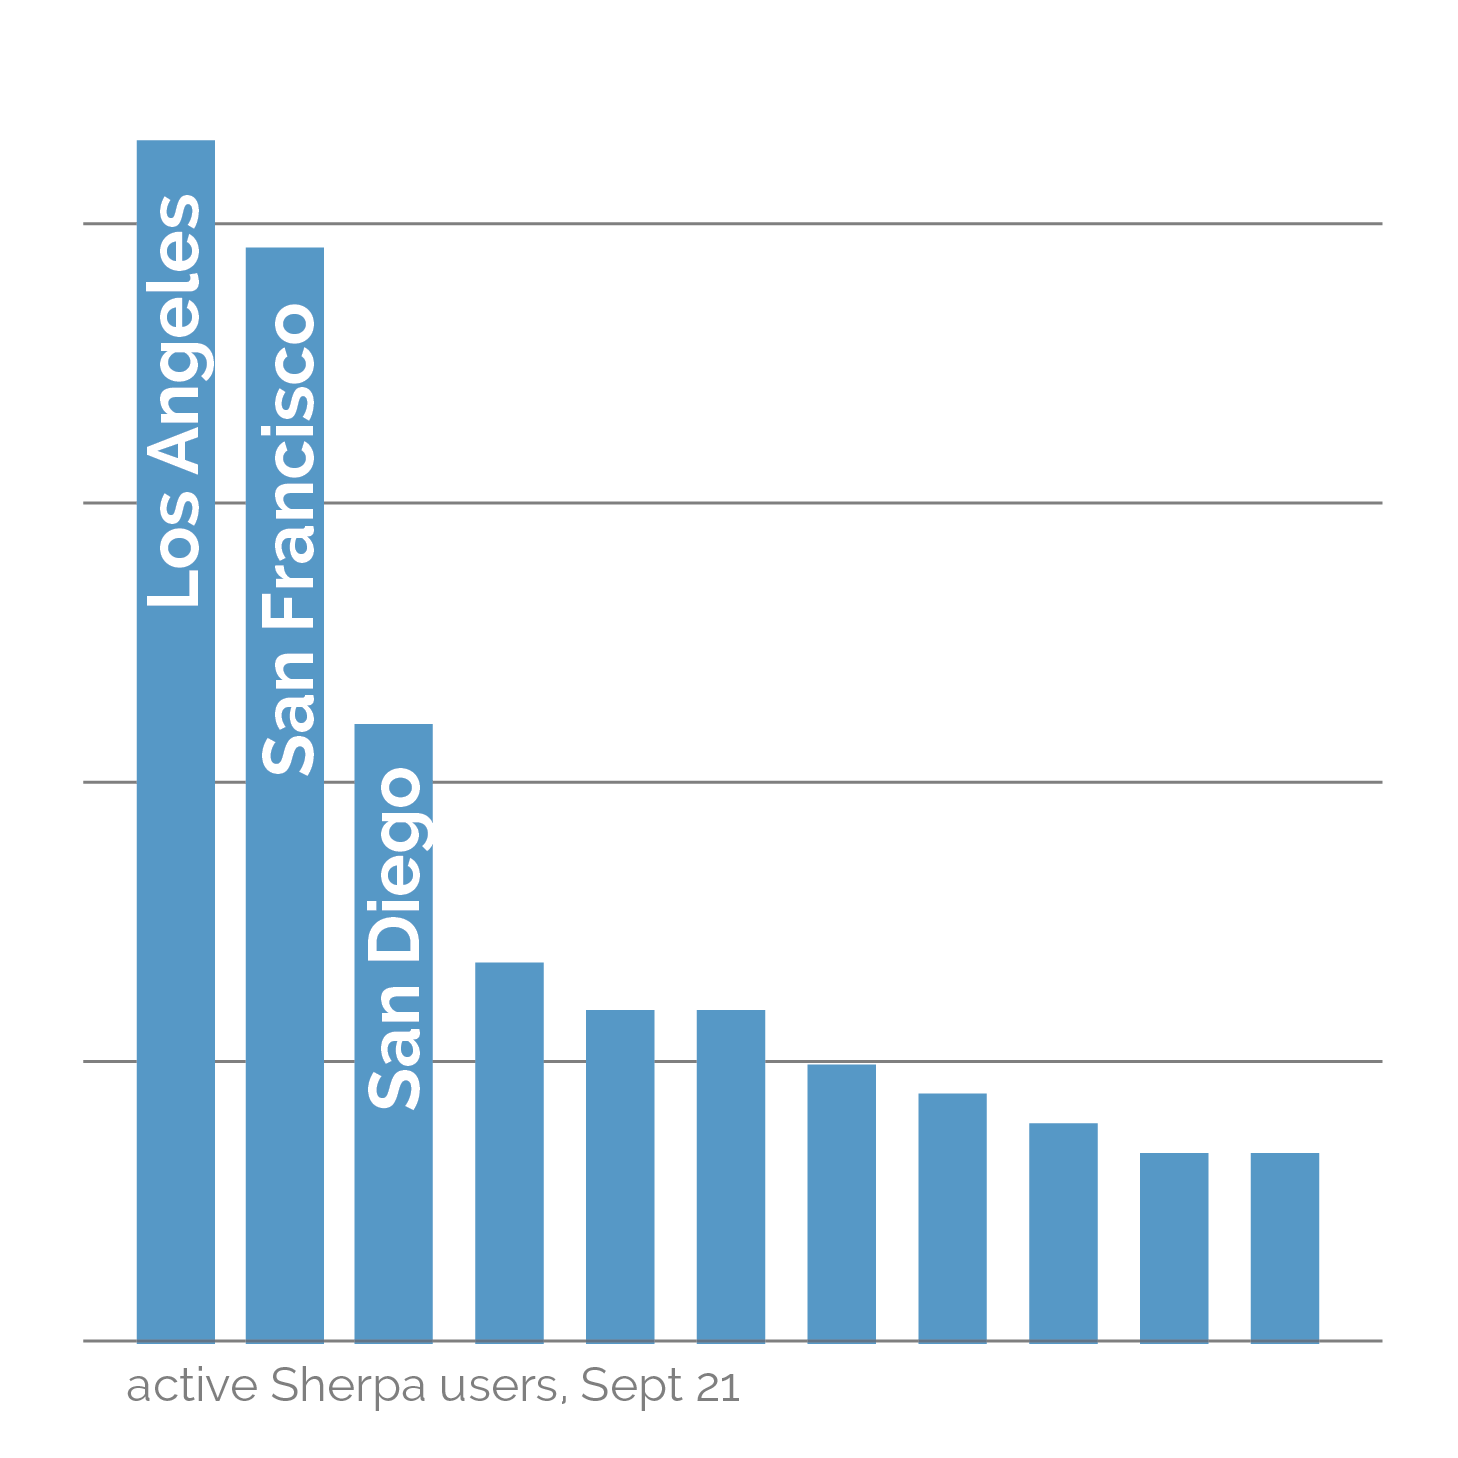
We're thrilled to see so many Lyft, Uber, and Sidecar drivers recently. The growth of drivers using Sherpa has been huge across the state, with Los Angeles, San Francisco, and San Diego leading the pack.
What does that mean for you? We can start giving you even more insights on driving trends, patterns, and averages to help you be a more efficient driver.
Enjoy the numbers, share with friends, and have a great weekend!
Want more awesome driving infographics? Create you free Sherpa account
Los Angeles, San Francisco, and San Diego driver growth
Active Sherpa drivers growing fast in California cities
Drivers in San Francisco, Los Angeles, and San Diego got the memo about Sherpa: Join Sherpa and not only do you get multi-platform financial management, but you also help build a network of independent contractors and services!
Last week, we’re thrilled that a big part of this California growth was due to our partnership with Sidecar.
Drivers in California are starting to see how more local driving data, trends, and patterns can help them understand how they’re doing and how they can start to make better driving decisions.
If you’re looking to be an early member of your cities network, it’s not too late to join.
A special thanks to all of the drivers who’ve been helping grow the Sherpa community. From San Francisco, this includes Dan, Amy, Ajay, Carlos, Linda, Mohammed, and Gurkan. In Los Angeles, the go-to drivers have been Trevor, Harry, Joel and Andres. And in San Diego, thanks to Heather and Hardy.
california, san francisco, san diego, los angeles, ambassadors
Your Sherpa Dashboard Explained - Part 1
Here's a look at what the data's telling you...
Wanted to better understand what your Dashboard is telling you? Here's your first guide to getting started.
The top level of your Dashboard gives you all your totals - total earnings, total mileage, total driving hours, total fuel cost, total estimated tax and tax write-offs. By default you'll see all services you've integrated with, but you can select and view just one (for example, select "Lyft" if you want to see just your Lyft earnings.)

After getting a sense of your overall numbers, perhaps you want to see how much you earned by day since the beginning of August, or by week? Or you just want to see these for your Sidecar earnings? Or you want to see trips per day or income per hour? Or how much you made in tips or bonus payments? Here you can sort through all of this.

For example, here's how your earnings look when you compare August to how you're doing half way through September

Next, you can see what days you tend to do more trips and what days you have a higher average income. You can adjust the date range here too

That's it for Part 1. Up next - a walk-through video and more details on the You vs Community and Reports and Analytics section. Let us know if there's anything else you'd like explained.
No account yet? Get Started
sherpa, dashboard, lyft, uber, sidecar, analytics
It's Official: Sidecar Partnership
Just one-step to integrate Sidecar with Sherpa

Today, we're thrilled to officially launch our partnership with Sidecar!
If you're a Sidecar driver, you'll now have the power to directly integrate with Sherpa analytics. We've worked with the Sidecar team closely to make this as easy as possible. No forwarding of email statements or attachments. With Sidecar, it takes only one step to getting insight into your driving income and expenses.
If you're an existing Sherpa user:
Simply click 'Activate Sidecar' on your Sherpa Dashboard
If you're new to Sherpa:
Click 'Activate Sidecar' and prepare for amazing analytics
If you haven't tried Sidecar:
Now's the time to get on board!


sidecar, sherpa, integration, analytics
Now Supporting UberBlack
Proud to support another Uber service on Sherpa
We're excited at Sherpa to support another Uber service! As a UberBlack driver you can integrate your earnings and trip information with Sherpa. It's easy to do! Go ahead and sign up. Or if you've already created a Sherpa account, here are the instructions
Want to be the first to tell this to your driving friends? Share on Facebook
uber, uberblack, uberx, lyft, sidecar.
Latest Active City Rankings
Several more cities have been added to the list!

Here are the Sherpa Active City Rankings for the week ending September 14. This is based on the number of active Lyft, Uber, and Sidecar drivers using Sherpa in their city. San Francisco is back at #1, Austin has moved from #19 to #11, and Nashville and Orlando make it into the top 20.
Also, several more cities now have access to CityMetrics data. Congrats to Atlanta, Cleveland, Detroit, Tampa Bay, and Washington, DC!
Create your free Sherpa account and choose your city
city rankings, city metrics
The original Sherpa Ambassadors
43 Lyft, Uber, and Sidecar drivers across the US
Huge shout-out to our original Sherpa Ambassadors from across the US. The 43 of them are in over 30 cities across the US, and helping improve the Sherpa Dashboard to help you make the most of your driving, and helping build your local community, to give you the best driving information in your city.
You can find most of them in your local Facebook driver group. Or if you'd like to find out your local city Ambassador or become an Ambassador in your city, send us a note!. We'd love to talk.

sherpa, ambassadors, lyft, uber, sidecar